U.S. stocks facing another test of 'Where's the bottom?'

U.S. stocks facing another test of 'Where's the bottom?': "

The U.S. stock market opens Wednesday with another big test looming: After Tuesday's late sell-off, key indexes were again near their lowest levels of the last two bruising weeks.


If the indexes fall decisively through those levels investors can expect to hear more predictions that the market is in danger of an accelerating decline.


You may not personally care to watch day-to-day stock chart patterns, but plenty of robot traders out there do exactly that for a living, unfortunately for the rest of us.


On Tuesday the Standard & Poor's 500 index (charted below) fell 18.70 points, or 1.7%, to close at 1,070.71 in an energy-sector-led slump. That left the index down 12% from its 19-month high reached April 23.


Spx The S&P had plunged to close at 1,071.59 on May 20, bounced the following day to 1,087.69, then fell again last week to finish at 1,067.95 on May 26. From there it bounced yet again, closing at 1,103.06 on May 27.


The Russell 2,000 small-stock index has traced a similar pattern, falling to 640.04 on May 20, rebounding, then sliding to 640.02 on May 25 before rising again late last week. On Tuesday the Russell index tumbled 3.1% to close at 640.96. It is down 13.6% from its April peak.


Although U.S. economic data still point to a continuing recovery, the market's list of other fundamental worries keeps getting longer. The two latest shocks: BP's failure over the weekend to stop its Gulf of Mexico oil gusher, and Israel's deadly takeover of a humanitarian flotilla bound for the Gaza Strip, which inflamed Mideast tensions.


Marc Pado, market strategist at brokerage Cantor Fitzgerald & Co., says the critical number for the S&P 500 is 1,040, which is about where it bottomed on an intraday basis in February and again in May.


"If it goes through there everyone will start talking about 1,000," Pado said. A drop to the 1,000 level would take the index down almost 18% from its April peak -- getting close to the 20% threshold that would mark a new bear market.


-- Tom Petruno

"

California may begin to outperform nation's economy in 2011, report says

California may begin to outperform nation's economy in 2011, report says: "
Comerica It’s pretty clear that California is currently in worse shape than the rest of the nation. Budget issues aside, the state’s unemployment rate, at 12.6%, is 2.7 percentage points higher than the nation’s. In March, the state’s unemployment rate was 2.9 percentage points higher than the nation's, setting a record difference.

But an economic brief released Tuesday by Comerica Bank suggests that California could begin to outperform the nation next year.

“California tends to be more cyclically sensitive than the national economy, suffering more in downturns but growing more rapidly during expansions,” wrote economist Dana Johnson in the research brief.

The state’s growth will be led, surprisingly, by the housing sector, Johnson said. Home prices are rising, which means people have more incentive to stay in their homes. The inventory of mortgage foreclosures is dropping in California, while it’s still rising nationally.

Home-building is traditionally a contributor to growth, but it hasn’t been strong yet in this recovery, which is partially why California is lagging. But because California’s housing sector is balancing more rapidly than the rest of the nation, the state could be in better shape next year, he said.

“The odds are growing that later this year or early in 2011, the state will get a bigger boost from homebuilding and could begin outperforming national trends,” Johnson wrote.

-- Alana Semuels

Photo credit: The Truth About ... via Flickr

"

Case-Shiller: LA Area Home Prices Rose Sharply in January

Case-Shiller: LA Area Home Prices Rose Sharply in January: "

It’s time for our monthly check-in of the S&P/Case-Shiller Home Price Indices (HPI). Keep in mind that all of the charts in this series of posts are based on the seasonally-adjusted data provided by S&P. For the full source data behind this post, plus non-seasonally adjusted data, hit the S&P/Case-Shiller website (requires free registration). For an explanation of how the Case-Shiller data is calculated, check out their methodology pdf. Also remember that the data released on the last Tuesday of a given month is for the period two months prior (i.e. – January data is released in March).


Here are the basic Case-Shiller stats for the Los Angeles area (which Case-Shiller defines as LA and Orange Counties) as of January:


January 2010

Month to Month: Up 0.9% (raw)

Month to Month: Up 1.8% (seasonally adjusted)

Year to Year: Up 3.9%

Prices last at this level in: November 2003 (and Dec.08)

Peak month: September 2006

Change from Peak: Down 36.9% in 40 months

Twelve of the twenty metro areas tracked by Case-Shiller saw an increase in their respective seasonally-adjusted HPIs between December and January (down from fourteen in November and December). Miami, Charlotte, New York, Dallas, Portland, Atlanta, Seattle, and Chicago all marked seasonally-adjusted drops month-to-month.


Here’s a look at LA’s latest tiered data, back through 2000:


LA Case Shiller Tiers 2010 01 Case Shiller: LA Area Home Prices Rose Sharply in January


All three of LA’s home price tiers got a pretty solid boost in January, with the low tier rising 1.8%, the middle tier bumping up 0.9%, and the high tier gaining 1.7%. With all three tiers rising at a rate in excess of 10% YOY, this screams “unsustainable” to me. It seems likely that this may just be a bounceback from a slight panic-driven overcorrection.


Here’s a chart of Case-Shiller HPIs for all the markets that Redfin serves:


Case Shiller Redfin Markets 2010 01 Case Shiller: LA Area Home Prices Rose Sharply in January


Here’s our peak decline chart, in which we line up the peak Case-Shiller HPI value for each of Redfin’s markets, so we can see how long each market has been declining, and how much it has dropped from the peak.


Case Shiller Peak Declines 2010 01 Case Shiller: LA Area Home Prices Rose Sharply in January


Here’s the flip side of the peak decline chart—a graph since January 2009, indexed to January 2009 = 100%:


Case Shiller 2009 Bounce 2010 01 Case Shiller: LA Area Home Prices Rose Sharply in January


Prices in the three California cities and Phoenix have all been pretty steadily increasing since last spring, but elsewhere the price rebound has been less convincing. Despite showing some stability through 2009, Seattle and New York both hit new post-peak lows in January.

"

Turn Any Room into a Home Theater

Turn Any Room into a Home Theater: "blue-home-theater-sz-020510.jpg It's easy to think that you have to have an extra room to properly create a home theater, but in reality you just need a fresh coat of paint and some wall sconces (and of course the right equipment) to get the cineplex feel.

Read Full Post"

The World's 18 Strangest Homes

The World's 18 Strangest Homes: "Strange Homes
A look at some innovative, bizarre and one-of-a-kind homes and what makes them stand out. The World's 18 Strangest Homes.

(thanks Linda)"

December DataQuick

December DataQuick: "

Today's DataQuick numbers for December ranged from a small uptick for Los Angeles to a small downtick for Ventura County, overall with little direction.

Los Angeles County's median was $339K, now down 38.4% from its peak in August 2007. Volumes were up 31% year-to-year from December 2008. (October DataQuick post)

That left Los Angeles County prices at August 2003, Orange County at August 2003, Ventura County at March 2003, and San Diego County at July 2002.

"

New to Market: 1920s Bungalow in West Hollywood

New to Market: 1920s Bungalow in West Hollywood: "


The listing for this two-bedroom, two-bath 1920s bungalow in West Hollywood notes the 'gorgeous mature trees throughout the property,' and indeed, the trees may be the best things about the property. At 1,386 square feet, the home is asking $849,000. It last sold in 1997 for $295,000. The location seems to be the question mark. This little slice of heaven is on Lexington---between Santa Monica and Fountain---just a stone's throw from that once-planned and now canceled housing project, a development some people thought might help to drive out the trannies from the hood.

· 7621 LEXINGTON Ave [Redfin]

"

Hip Green Gable: Tiny-Plan House Framed by Far-Out Roof

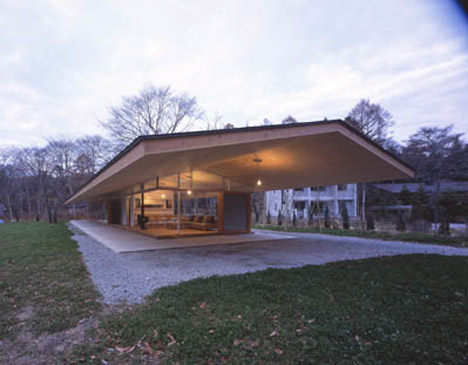
Hip Green Gable: Tiny-Plan House Framed by Far-Out Roof: "[ Filed under Contemporary or in the Architecture category ]

Hip as in cool (not the type), green as in eco-friendly (not the book), this far-reaching wood roof ends far past the framing of the outer house walls – a shade-supplying cantilever that is awesomely out-of-scale with the small home sheltered beneath it.

If ceilings can be said to define spaces then this giant domestic overhang extends the interior area of the core home plans a good distance in all directions. Or, if porch and patio layouts provide a psychological buffer between a house and the exterior world, then the residents here must feel very cozy, safe and secure indeed.

Year-round shade saves on heating expenses while indirect daylight still comes in on all sides, reducing the need for artificially-powered lamps.  Showing off the amazing strength of wood in conditions of extreme extension, this home was designed by Tezuka Architects and constructed via traditional framing and conventional carpentry techniques – just taken a few steps further than those simple a-frames we sketched as children.


Keep Going - Check out this Great Related Dornob Design:


Share on Facebook [ Dornob Design - Filed under Contemporary or in the Architecture category ]


"